Objective
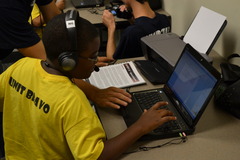
In this activity kids will get to see signal representation of speech. They will learn about frequency and why speech differs. Learn more about signal represenation by reading Speech Recognition.
Equipment
Notebook Computer with Matlab, Printer
Headset with Microphone
Calculator
Activity
1. Start Matlab.
2. Say your name using Mathlab script.
3. Use the Matlab GUI to zoom in on a vowel, to see the frequency of your speech.
4. Use matlab to print subplots, one showing the signal representation of your name, the other showing just the vowel.
5. Print the plots and save to in a folder.
6. Place your fingers on the vocal cords while speaking, to feel the vibration.
7. Compute the frequency of yourvoice, using the plot. Speech is sampled at 8 kHz (8000 samples = 1 sec).
8. Compare plots and frequencies to others.
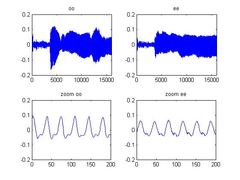
 Here is an example using a preliminary plot. The details will change when the actual GUI is developed.
In the lower left plot, we can see the repetition of the signal. Two lines are drawn where the signal repeats. The first line is around the 25th sample, and the second is around sample 165. There are 4 cycles or repetitions in between. Because the signal was sampled at 8000 Hz, the frequency of the voice is approximately:
f=(4 cycles)/((165-25) samples)×8000samples/second = 228 Hz
Number of repetitions, N
Sample # at start of 1st cycle, K
Sample # at end of Nth cycle, M
Frequency (Hz) = N*8000/(M-K)
To check your answer, note that an adult male usually has a frequency in the range 85-180 Hz, and an adult female voice has a frequency in the range 165-255 Hz. Higher voices have higher frequencies. (An orchestra tunes to an A440, meaning the note "A" at a frequency of 440 Hz.)


What other people said
Average Rating (0)
Log in or Join now to rate this activity!