Background
In this activity you will get to measure bones to figure out the height of the skeleton. It only takes one bone's measurement to apporixamate a person's height! Read Paleontology and Forensic Anthropology to learn more!
Objective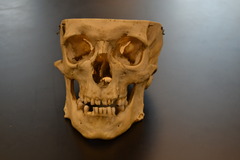
Gain experience with paleontology.
Equipment
4 Tape Measures (or use string and rulers)
Rulers
Pencils
Worksheets
Graphs
Activity
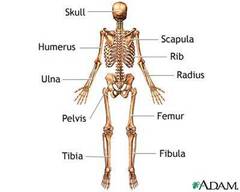 Working with a partner, you will measure each other's height, femur, humerus, and radius (approximately). Feel for the bony ends. For the femur, sit in a chair with knees bent and measure from the top of the knee to mid-hip on the side. Estimate the height from bone lengths. Compare your estimation with actual height. What are some possible causes of differences? (measurement error, using model for grown adult...).
Example:
| Inches | cm (1cm=2.54in) | Predicted Height (cm) | Predicted-Actual (cm) | |
|---|---|---|---|---|
| Femur | 17 | 43 | 164.18 | 4.18 |
| Humerus | 12 | 30 | 162.85 | 2.85 |
| Radius | 9 | 23 | 165.95 | 5.95 |
| Height | 63 | 160 | - | - |
Worksheet
Working with a partner, measure your height, and the length of your femur, humerus, and radius.
Measure height against the wall.
Use rulers to measure the other bones (approximately). You may need to put 2 rulers together. Feel for the bony ends. For the femur, sit in a chair with knees bent and measure from the top of the knee to mid hip on the side.
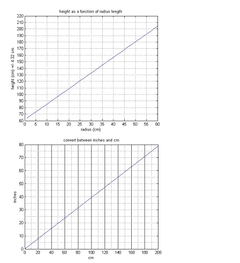
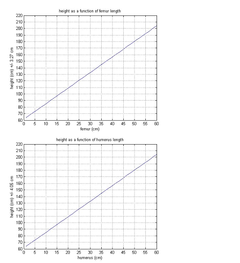
Use the chart and the following equations to estimate height from bone lengths.
Femur: 2.38 x l_femur + 61.41 cm = height in cm ± 3.27
Humerus: 3.08 x l_humerus + 70.45 = height in cm ± 4.05
Radius: 3.78 x l_radius + 79.01 = height in cm ± 4.32
Compare with actual height.
What are some possible causes of differences? _________________________________________
Group activity: Plot actual height vs. femur length (scatter plot). Do the points seem to follow a line? Draw a line through the scatter plot to give a prediction of the data.







What other people said
Average Rating (0)
Log in or Join now to rate this activity!